The Java Affect Map
This program is written by Dan Ivancic for the SUNY Oswego Psychology Department, specifically the Learning and Emotion Lab run by Professor Roger Taylor. It is designed to automate and simplify the task of collecting affective information from research participants for both professional and student research. It is freely available for download and use in non-profit student research. This page explains the various graphic styles for presenting the prompt as well as a guide for using the setup screen.
Graphic Styles
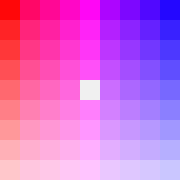
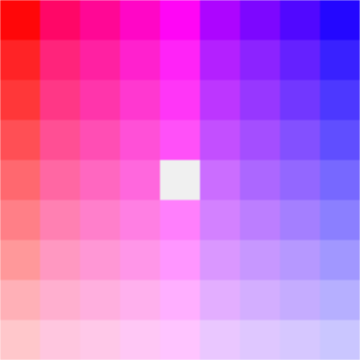
Discrete
-A grid of 80 separately colored squaresSelection is made by clicking on the map.
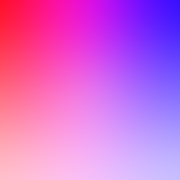
Continuous
-A gaussian blend of the Discrete mapSelection is made by clicking on the map.
Two Scaled: Discrete
-A nine-point likert scale with discrete color valuesSelection is made by clicking a specific square,
when a selection is made from both scales the input is accepted.

Two Scaled: Continuous
-A nine-point likert scale with gaussian blended colorSelection is made fluidly by click/click-dragging across the scale,
when a selection is made from both scales the input is accepted.

Likert
-A nine-point likert scale modeled after a standard paper questionnaireSelection is made by clicking a specific point,
when a selection is made from both scales the input is accepted.

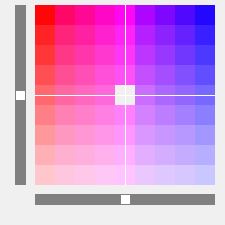
Slider: Discrete
-The discrete graphic overlaid by a 'crosshair' selection toolSelection is made by click/click-dragging on the map surface
or alternatively by click/click-dragging on either scrollbar,
input is taken when the enter/return key is pressed.
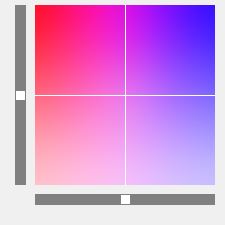
Slider: Continuous
-The continuous graphic overlaid by a 'crosshair' selection toolSelection is made by click/click-dragging on the map surface
or alternatively by click/click-dragging on either scrollbar,
input is taken when the enter/return key is pressed.
Large: Discrete
-A vector-enlarged version of the discrete graphicSelection is made by clicking on the map.
Large: Continuous
-A vector-enlarged version of the continuous graphicSelection is made by clicking on the map.
